The Science, Health, and Technology Room


Originally Posted by skepticalmike
 I addressed the central question: global warming or bad data. I chose global warming. I wanted to make my post short so I picked the change in ocean energy storage as the best evidence for
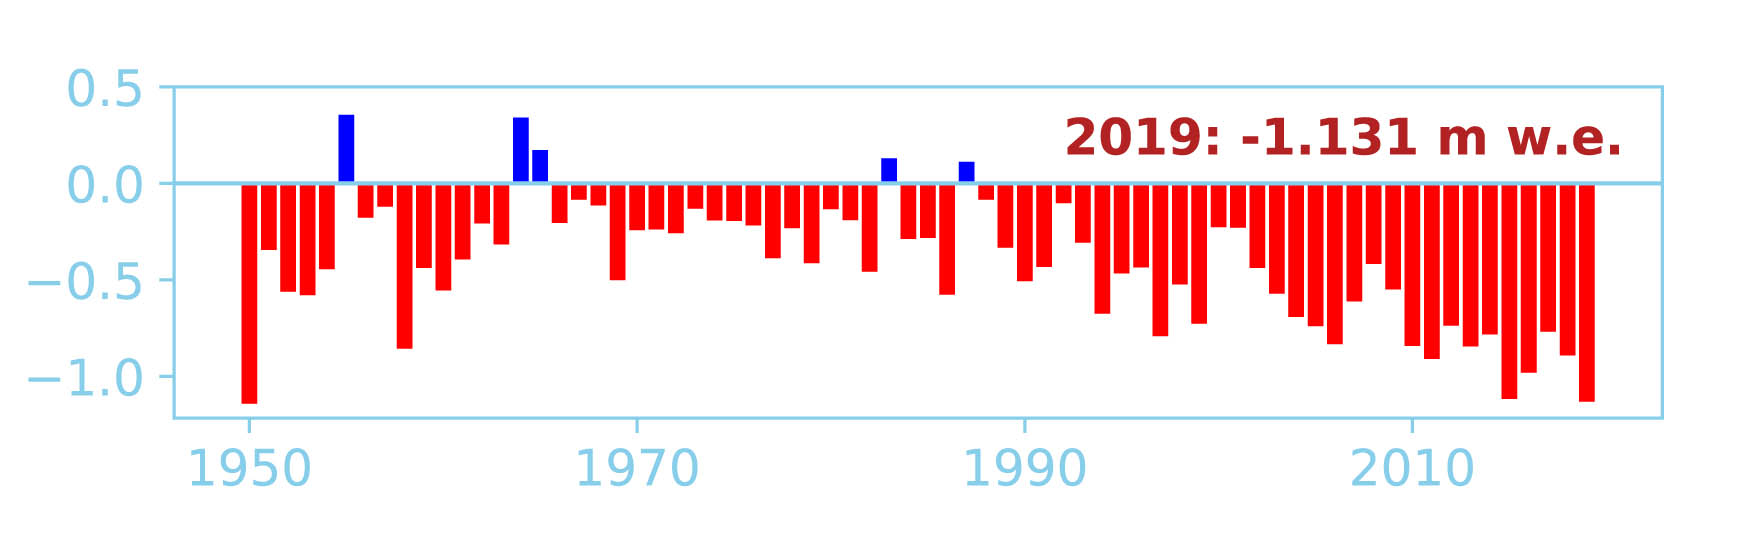
global warming. Approximately 92% of any energy imbalance of the earth goes into heating the oceans. During the 2005 to 2010 time period James Hansen of NASA measured an energy
imbalance of +0.58 +/- 0.15 watts per square meter. That measurement took place during a prolonged solar minimum so the energy imbalance was biased low. This is a very significant finding
and it indicates that global warming was obviously happening, it was not caused by internal variation or natural causes, and that there was additional warming in the pipeline in 2010 because the
earth's surface had not finished responding to the planetary energy imbalance.
Both paragraphs and Figure 2 are from skepticalscience.com, "Are Surface Temperature Records Reliable"
In 2009 some people worried that weather stations placed in poor locations could make the temperature record unreliable. Scientists at the National Climatic Data Center took those critics seriously and did a careful study of the possible problem. Their article "On the reliability of the U.S. surface temperature record" (Menne et al. 2010) had a surprising conclusion. The temperatures from stations that critics claimed were "poorly sited" actually showed slightly cooler maximum daily temperatures compared to the average.
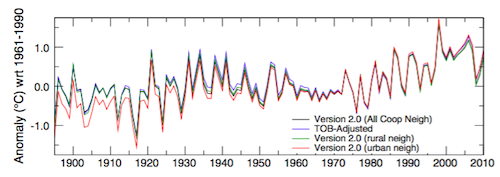
In 2010 Dr. Richard Muller criticized the "hockey stick" graph and decided to do his own temperature analysis. He organized a group called Berkeley Earth to do an independent study of the temperature record. They specifically wanted to answer the question is "the temperature rise on land improperly affected by the four key biases (station quality, homogenization, urban heat island, and station selection)?" Their conclusion was NO. None of those factors bias the temperature record. The Berkeley conclusions about the urban heat effect were nicely explained by Andy Skuce in an SkS post in 2011. Figure 2 shows that the U.S. network does not show differences between rural and urban sites."
Figure 2. Comparison of spatially gridded minimum temperatures for U.S. Historical Climatology Network (USHCN) data adjusted for time-of-day (TOB) only, and selected for rural or urban neighborhoods after homogenization to remove biases. (Hausfather et al. 2013)
Frankly, I don't see that claim in the OP, only that bad input results in back output. You're just arguing your favorite climate change argument.
 Reply With Quote