The Science, Health, and Technology Room


And climate science has always suffered from the problem of shaky and missing data. Seventy percent of the globe is covered by ocean, where data is hard to collect. Reliable weather records only go back to about 1850 and, in many parts of the world, are far more recent. Modern recording weather stations date only to the early 20th century.
And many of those stations have a big problem. While they havent changed appreciably over the years, the land around them has changed, often profoundly, with the great growth in urban and suburban areas. The weather station that was put, say, in the middle of a Nassau County, Long Island, potato field in 1923 is still in the same spot. But the potatoes are long gone, and now its behind a strip mall, twenty feet from the kitchen exhaust fan of a Chinese take-out joint.
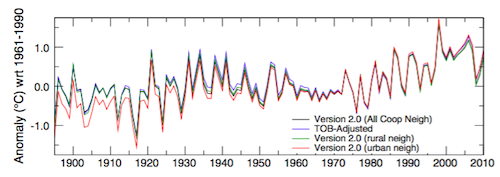
A study by meteorologist Anthony Watts found that almost 90 percent of the 1221 weather stations in the U.S. did not meet the National Weather Services setting standards, which requires that they be at least 100 feet from any artificial heat source or radiating surface. You can see some of the most egregious violators here. To deal with this defective information, climate scientists, have adjusted the data to solve this problem. Invariably, these adjustments have made earlier data show lower temperatures, and recent data show higher ones.
To develop reliable data, the National Oceanic and Atmospheric Administration (NOAA) placed 114 state-of-the-art weather stations relatively evenly spaced about the lower 48 states. They were carefully sited to be away from urban areas, which are heat islands, airports, which can be affected by jet exhaust, etc.
The system became operative in 2005. Now, realclearenergy.com is reporting that there has been no increase in average temperatures in the continental United States over the last 14 years, as measured by these new stations. If anything, overall temperatures are slightly cooler than they were.
As a result, the U.S. CO2 emissions are down to where they were in 1985a third of a century ago, when the GDP was half what it is now in inflation-adjusted terms, and the population was smaller by a quarter. No other industrialized country has come anywhere close to reducing their emissions by so much......snip~
https://www.commentarymagazine.com/p...ata-locations/
Yes garbage in.....that is what the left always brings with it. Although many know the other aspect.....which is the left and its intention to deceive people. You know lie about $#@!. Make $#@! up. Be about falsehoods and ignore history until they can change it. As because always with a leftist, the ends justifies the means.
 Reply With Quote